library(tidyverse)

# If purrr is not detected, install the package
if (!"purrr" %in% installed.packages()) install.packages("purrr")

source("https://raw.githubusercontent.com/statistical-computing-r/spring-2026/main/labs/instructions/lab-7-setup.R")Lab 7: Murder in SQL City
join + filter + stringr + ludridate
For this lab, you will be joining and filtering related datasets to solve a murder mystery!
Part One: Set-up
GitHub Workflow
We will use GitHub Classroom to submit Lab 7.
Step 1: Access GitHub Classroom Assignment
Click on the following link to create your repository for Lab 7: Murder in SQL City.
Accept Assignment Invitation
You will need to accept the assignment invitation by clicking the link sent to your email account associated with your GitHub account and then go to the link provided for the repository. Otherwise it will say you do not have access.
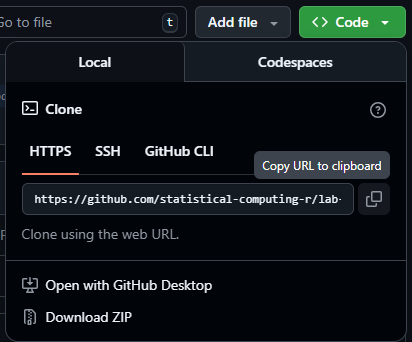
Step 2: Copy the HTTPS Link to the Repository
Find the <> Code button and select Local and then HTTPS. Copy the URL for the Repository provided
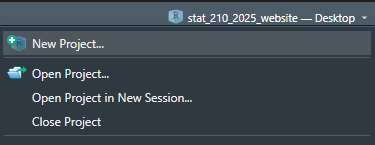
Step 3: Make a New Project in RStudio
Either under File, or in the top right corner where the current project name is, select
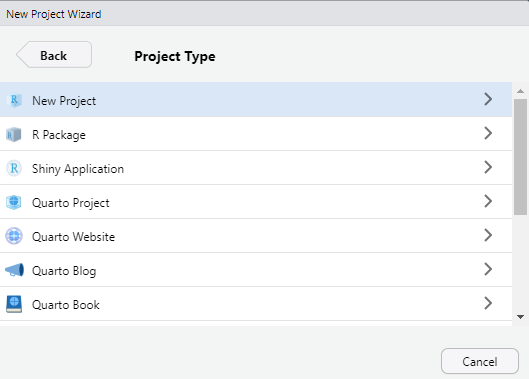
Step 4: Choose New Project
For now, we are simply creating a New R Project. This will generate a .Rproj file and folder of the same name to store all of our content and set our working directory.
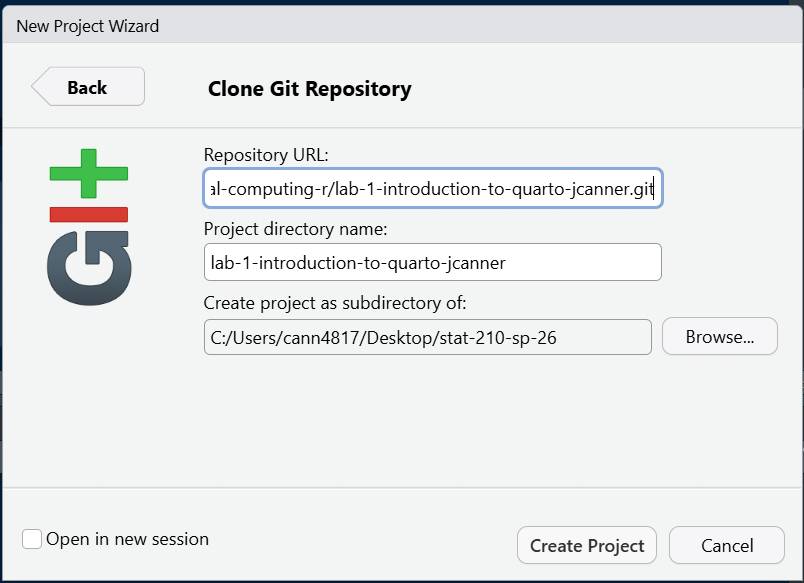
Step 5: Choose a Version Control
Choose Version Control and then Git. Then paste the HTTPS link to the GitHub repository into the spot for Repository URL. Be sure to check that you are saving the project in the correct sub-directory on your computer. Do Not Change File Name - it should match the repository name.
Now you should be set up and ready to go!
Step 6: Add Files to your Project
Be sure to set up a GitHub repository and then use Version Control to set up your Lab R Project so it is connected. Then download this week’s lab file into the folder and create a data-raw and data-clean folder and store the provided data appropriately:
- lab-7-student.qmd
- The data for the lab are coming from a database that you will import (code is provided). It includes several different data sets.
Important
Now is a good time to commit and push your changes before you start making more edits to the lab file.
Tip
I advise you to focus particularly on:
Setting chunk options carefully.
Making sure you don’t print out more output than you need.
Making sure you don’t assign more objects than necessary. Avoid “object junk” in your environment.
Making your code readable and nicely formatted.
Thinking through your desired result before writing any code.
Part Two: Finding the Killer
Northwestern University’s Knight Lab wanted to help sharpen users’ database skills, so they created a murder mystery. Can you solve this crime in SQL City??
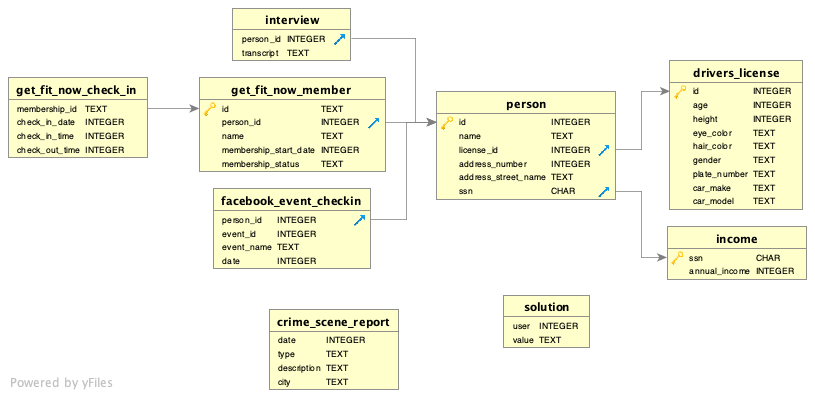
The relational data you will be working with contains tables with different pieces of information pertinent to the crime - people, social media check-ins, driver’s licenses, crime scene reports, police interviews, and more!
Tip
You may find the pull() function handy for displaying each clue as you go along.
Access the Data
This code chunk will read in all of the tables of data for you. Don’t modify or remove this! Take some time to look at each file type so that
Solve the Crime
Step 1: Crime Scene Report
Detective Wickham reaches out to you…
A crime has taken place and I need your help! There was a murder in SQL City sometime on January 15, 2018. Could you retrieve the crime scene report from the police department’s database and follow the clues to find the person responsible for the murder?!
Find the police report in crime_scene_report. Then used the information in the report to move on to the next data source based on the information learned.
# Code for looking at the relevant crime scene report.Next Steps
Follow the evidence to the person responsible for the murder, building a report as you go.
Solve the murder mystery, showing all of your work in this document. Your document and code must be well organized, easy to follow, and reproducible.
- Use headers and written descriptions to indicate what you are doing.
- Use separate labeled code-chunks for each complete pipe/output
- Use
dplyrverbs andjoinfunctions rather than just looking through the tables manually. Functions fromstringrandlubridatewill also be useful. - Use good code formatting practices.
- Comment your code.
- Cite any external sources you use to solve the mystery.
Caution
Make sure you check for interviews with any suspects!
Identify the Mastermind!
And the final suspect is…
put the name of the person responsible for the murder here.