fish <- fish |>
  mutate(length = (length - min(length, na.rm = TRUE)) /
           (max(length, na.rm = TRUE) - min(length, na.rm = TRUE)),
         weight = (weight - min(weight, na.rm = TRUE)) /
(max(weight, na.rm = TRUE) - min(length, na.rm = TRUE)))Lab 8: Functions + Fish
The goal of this lab is learn more about exploring missing data and writing modular code and functions.
Part One: Set-up
GitHub Workflow
We will use GitHub Classroom to submit Lab 8.
Step 1: Access GitHub Classroom Assignment
Click on the following link to create your repository for Lab 8: Functions + Fishes.
Accept Assignment Invitation
You will need to accept the assignment invitation by clicking the link sent to your email account associated with your GitHub account and then go to the link provided for the repository. Otherwise it will say you do not have access.
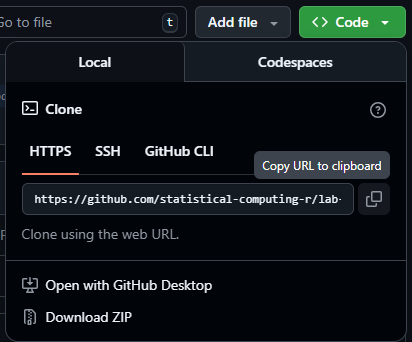
Step 2: Copy the HTTPS Link to the Repository
Find the <> Code button and select Local and then HTTPS. Copy the URL for the Repository provided
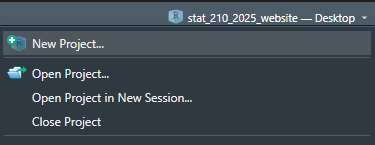
Step 3: Make a New Project in RStudio
Either under File, or in the top right corner where the current project name is, select
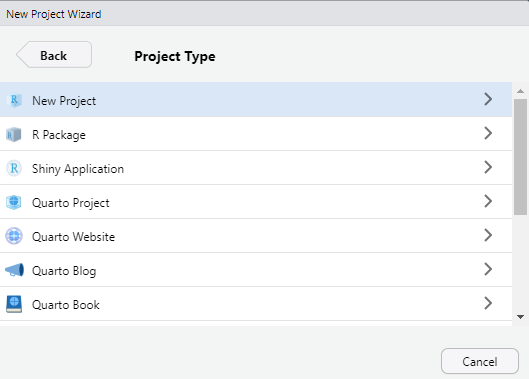
Step 4: Choose New Project
For now, we are simply creating a New R Project. This will generate a .Rproj file and folder of the same name to store all of our content and set our working directory.
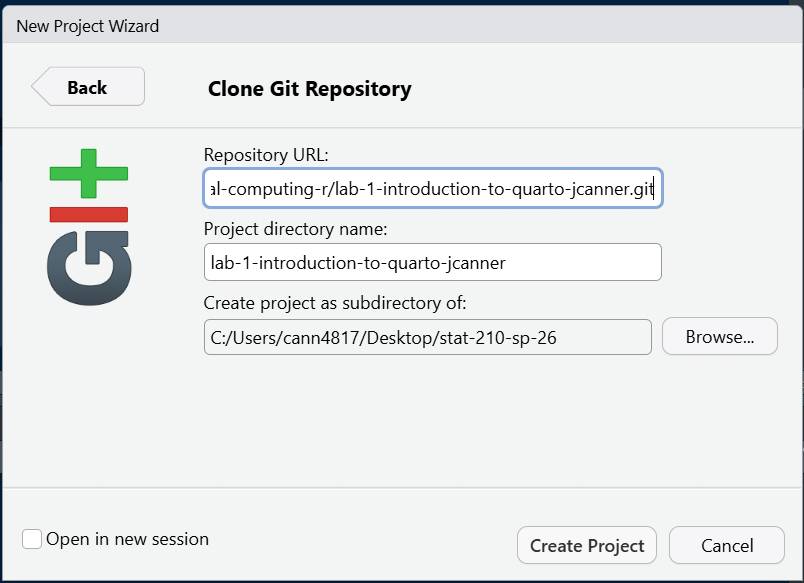
Step 5: Choose a Version Control
Choose Version Control and then Git. Then paste the HTTPS link to the GitHub repository into the spot for Repository URL. Be sure to check that you are saving the project in the correct sub-directory on your computer. Do Not Change File Name - it should match the repository name.
Now you should be set up and ready to go!
Step 6: Add Files to your Project
Be sure to set up a GitHub repository and then use Version Control to set up your Lab R Project so it is connected. Then download this week’s lab file into the folder and create a data-raw and data-clean folder and store the provided data appropriately:
Important
Now is a good time to commit and push your changes before you start making more edits to the lab file.
Tip
I advise you to focus particularly on:
Setting chunk options carefully.
Making sure you don’t print out more output than you need.
Making sure you don’t assign more objects than necessary. Avoid “object junk” in your environment.
Making your code readable and nicely formatted.
Thinking through your desired result before writing any code.
The Data
This lab’s data concerns mark-recapture data on four species of trout from the Blackfoot River outside of Helena, Montana. These four species are rainbow trout (RBT), westslope cutthroat trout (WCT), bull trout, and brown trout.

Mark-recapture is a common method used by ecologists to estimate a population’s size when it is impossible to conduct a census (count every animal). This method works by tagging animals with a tracking device so that scientists can track their movement and presence.


Data Exploration
The measurements of each captured fish were taken by a biologist on a raft in the river. The lack of a laboratory setting opens the door to the possibility of measurement errors.
1. Let’s look for missing values in the dataset. Output ONE table that answers BOTH of the following questions:
- How many observations have missing values?
- What variable(s) have missing values present?
You should use
across()!
2. Using map_int(), produce a nicely formatted table of the number of missing values for each variable in the fish data that displays the same information as 1a
3. Create ONE thoughtful visualization that explores the frequency of missing values across the different years, sections, and trips. Do not use naniar, use ggplot2.
Rescaling the Data
If I wanted to rescale every quantitative variable in my dataset so that they only have values between 0 and 1, I could use this formula:
\[y_{scaled} = \frac{y_i - min\{y_1, y_2,..., y_n\}}{max\{y_1, y_2,..., y_n\} - min\{y_1, y_2,..., y_n\}}\]
I might write the following R code to carry out the rescaling procedure for the length and weight columns of the BlackfoorFish data:
This process of duplicating an action multiple times can make it difficult to understand the intent of the process. Additionally, it can make it very difficult to spot mistakes.
4. What is the mistake I made in the above rescaling code?
When you find yourself copy-pasting lines of code, it’s time to write a function, instead!
5. Transform the repeated process above into a rescale_01() function. Your function should…
- … take a single vector as input.
- … return the rescaled vector.
Efficiency
Are you calling the same function multiple times? You might want to look into the range() function. Hint - our preparation for functions covered this!
6. Let’s incorporate some input validation into your function. Modify your previous code so that the function stops if …
- … the input vector is not numeric.
- … the length of the input vector is not greater than 1.
Modify Previous Code
Do not create a new code chunk here – simply add these stops to your function above!
Test Your Function
7. Run the code below to test your function. Verify that the maximum of your rescaled vector is 1 and the minimum is 0!
x <- c(1:25, NA)

rescaled <- rescale_01(x)
min(rescaled, na.rm = TRUE)
max(rescaled, na.rm = TRUE)
Next, let’s test the function on the length column of the BlackfootFish data.
8. The code below makes a histogram of the original values of length. Add a plot of the rescaled values of length. Output your plots side-by-side, so the reader can confirm the only aspect that has changed is the scale.
Warning
This will require you to call your rescale_01() function within a mutate() statement in order to create a length_scaled variable.
fish |>
  ggplot(aes(x = length)) +
  geom_histogram(binwidth = 45) +
  labs(x = "Original Values of Fish Length (mm)") +
  scale_y_continuous(limits = c(0,4000))

# Code for Q8 plot.
Tip
Set the y-axis limits for both plots to go from 0 to 4000 to allow for direct comparison across plots.
Pay attention to
binwidth!Use a Quarto code chunk option to put the plots side-by-side.
Challenge: Use Variables within a Dataset
Suppose you would like for your rescale() function to perform operations on a variable within a dataset. Ideally, your function would take in a data frame and a variable name as inputs and return a data frame where the variable has been rescaled.
9. Create a rescale_column() function that accepts two arguments:
- a dataframe
- the name(s) of the variable(s) to be rescaled
The body of the function should call the original rescale_01() function you wrote previously. Your solution MUST use one of the rlang options from class.
Tip
If you are struggling with this task, I recommend looking back over the data frame functions section of R for Data Science!
10. Use your rescale_column() function to rescale both the length and weight columns.
Warning
I expect that you carry out this process by calling the rescale_column() function only ONE time!